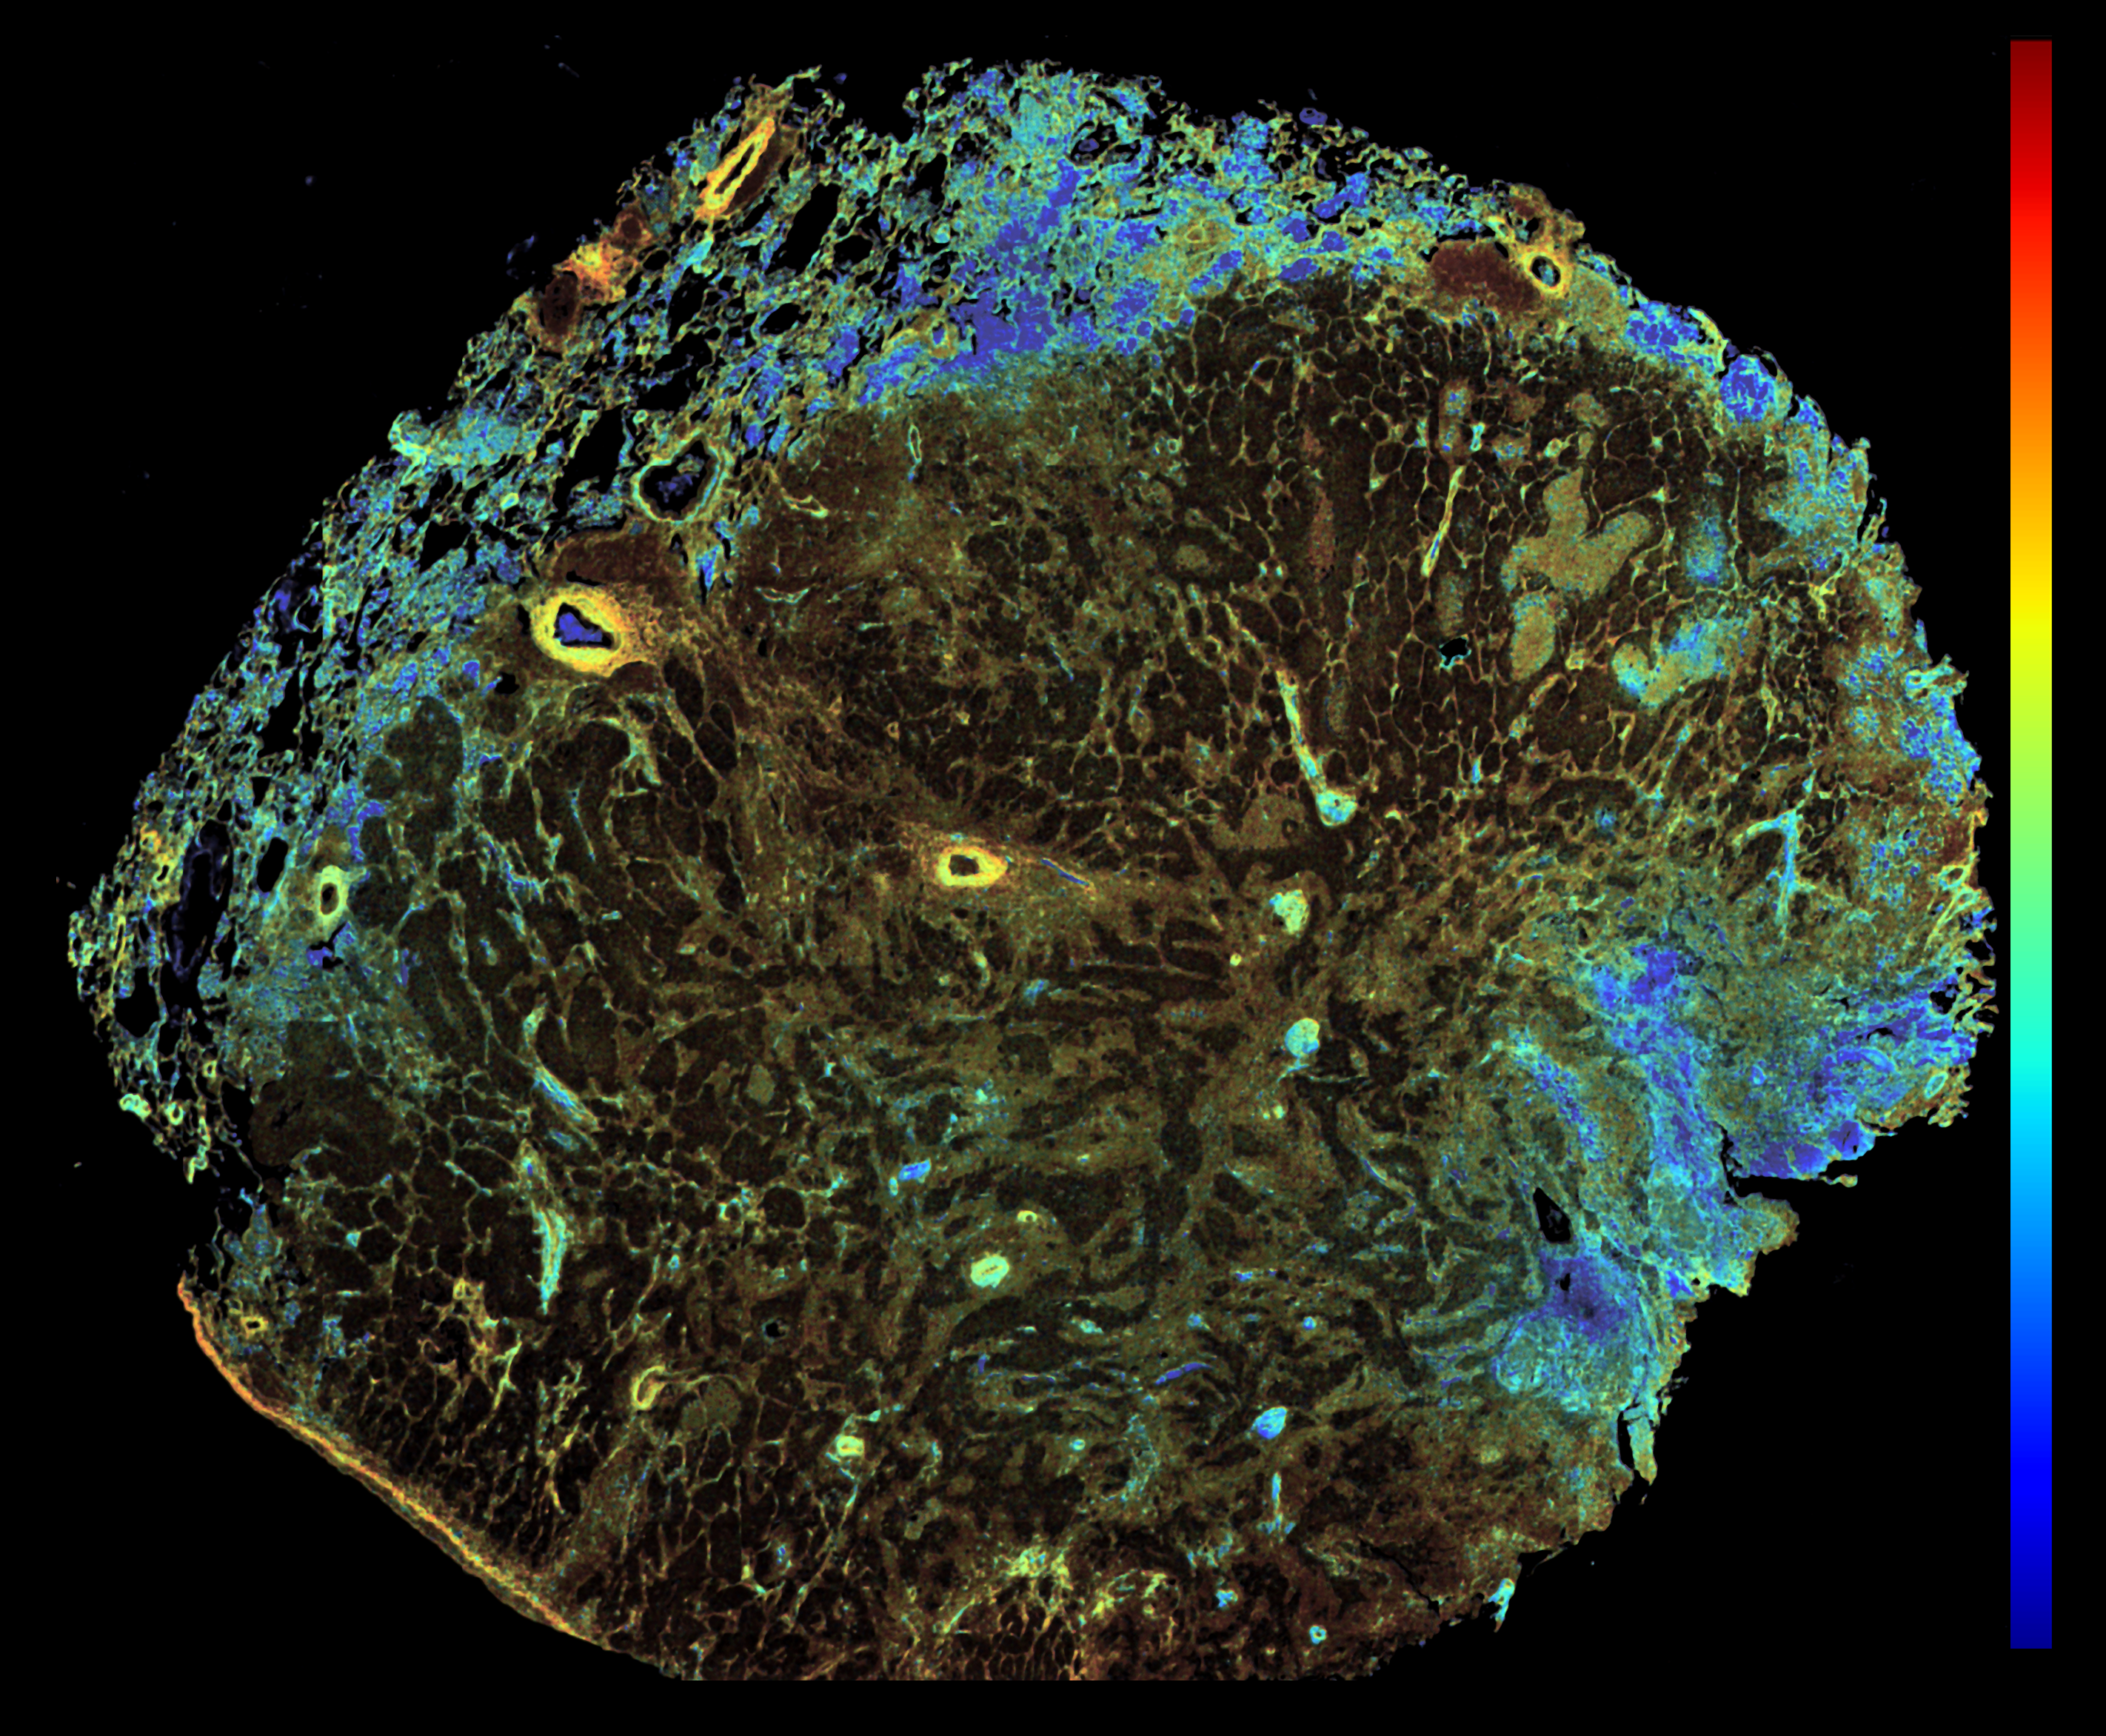
This image was shared by Jackson Riseman, Wonsang Hwang, and Conor Evans at Ludwig Harvard.
“We captured this image when we were developing a label-free fluorescence lifetime imaging (FLIM) protocol designed specifically for routine formalin-fixed paraffin-embedded (FFPE) tissue sections, aiming to map the metabolic states within solid tumors,” Conor told us. The image captures NADH signals from an FFPE lung carcinoma section. Blue regions indicate glycolysis. Red regions signify oxidative phosphorylation. By measuring the intrinsic fluorescence lifetime of NADH, the method distinguishes areas dominated by glycolysis (short-lived, free NADH) from those relying on oxidative phosphorylation (long-lived, protein-bound NADH). This image is a whole-section overview obtained during method validation, demonstrating that a single-slice FLIM measurement effectively preserves histological context while clearly visualizing the spatial heterogeneity of tumor metabolism. “Our research is still at an early stage, and there is much yet to uncover about the precise implications of these observed metabolic patterns, so I’m cautious about interpreting this data,” Conor said. “But I personally find this image interesting because it appears to reveal spatial features of the tumor microenvironment that, to my knowledge, have not previously been reported. The lifetime map clearly exposes metabolic heterogeneity, not only within the tumor core but also in the surrounding tissue that appears histologically normal.” The jet color map ranges from 1 ns (blue) to 3 ns (red). Scale bar: 2 mm.
This image was shared by Kornelia Polyak, Jun Nishida and Kun Huang at Ludwig Harvard.
“Breast cancer brain metastasis is a devastating disease with limited treatment options,” Kornelia told us. “We have been characterizing the spatial heterogeneity of breast cancer brain metastases with the aim of better understanding how cancer cells adapt to grow in the tissue microenvironment of the brain, and how we might be able to target this process to treat brain metastases. This is a phenocycler image visualizing immune cells (magenta, cyan) in a brain metastasis of breast cancer (cancer cells, red). It shows how immune cells accumulate at the interface of the tumor and its stroma. Research on brain metastasis holds a special meaning for Jun Nishida, the fellow leading this project, as he lost a family member to this disease.”
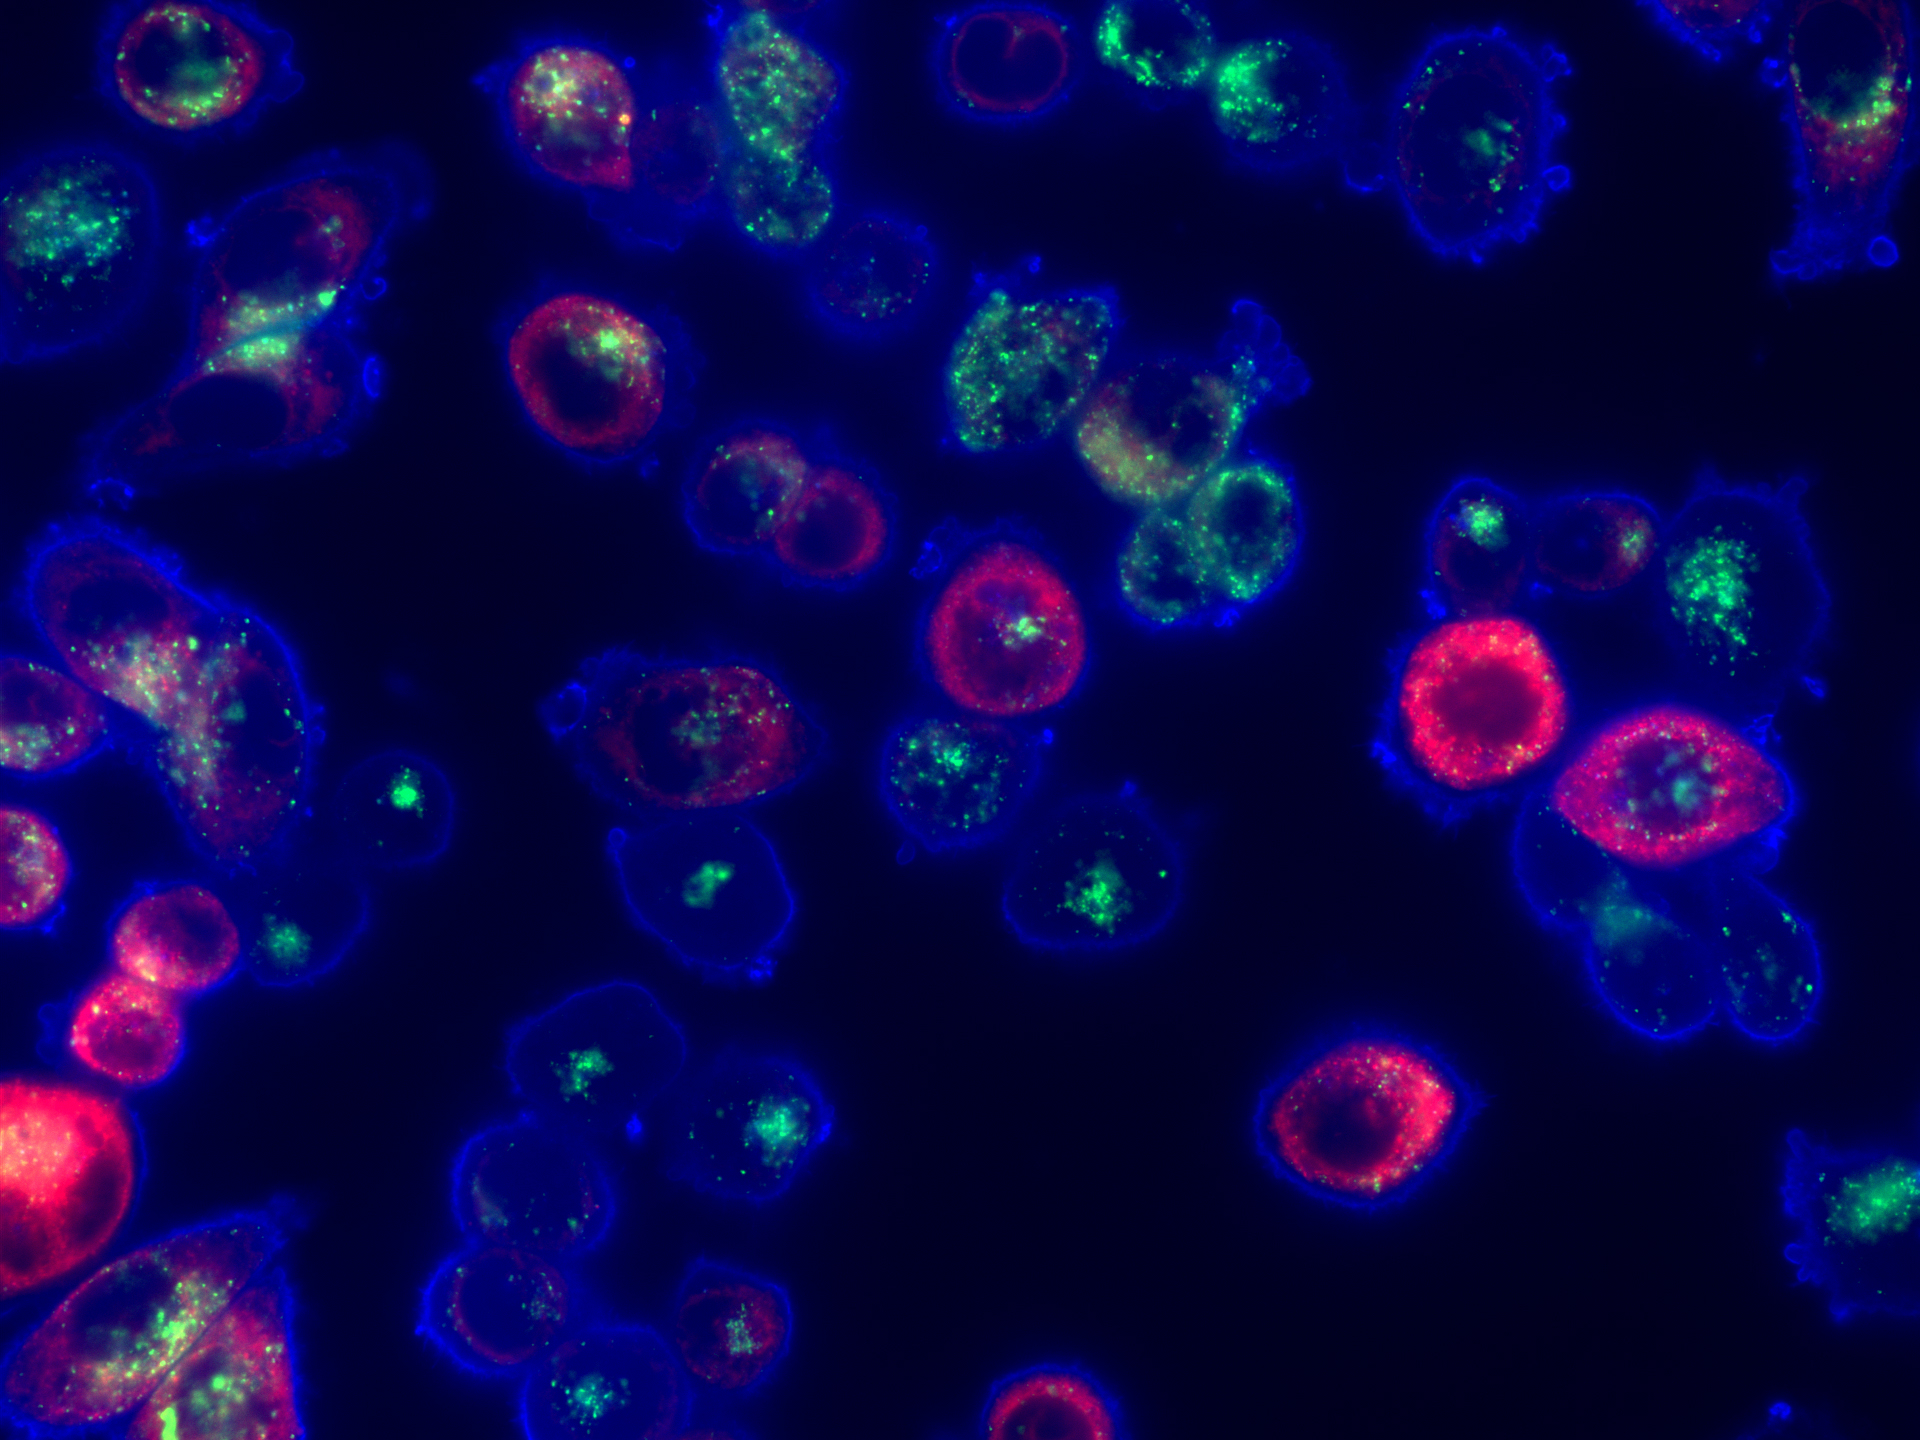
This image was shared by Alex Toker at Ludwig Harvard.
The image (which looks to the Link a little like something from the Hubble Space Telescope) shows MDA-MB-468 triple negative breast cancer (TNBC) cells growing in vitro, stained with markers to detect cellular localization of cholesterol. It stems from a study reported last year by Ludwig Harvard’s Alex Toker and alumnus Alissandra Hillis, who found that treatment with AKT inhibitors makes TNBC cells exceptionally vulnerable to disruptions in their cholesterol balance (homeostasis) induced by a statin drug (pitavastatin). Combining an FDA-approved AKT inhibitor with pitavastatin kills TNBC cells in patient-derived estrogen receptor (ER)–negative breast cancer organoids and impairs tumor growth and decreases tumor size in mice bearing xenografts of TNBC tumors. The blue channel is Filipin III which stains cholesterol, the green channel is LAMP1, a lysosomal marker, and the red channel is an endoplasmic reticulum marker using a red fluorescent protein tagged expression construct. The staging pattern shows a predominantly plasma membrane cholesterol localization at baseline.
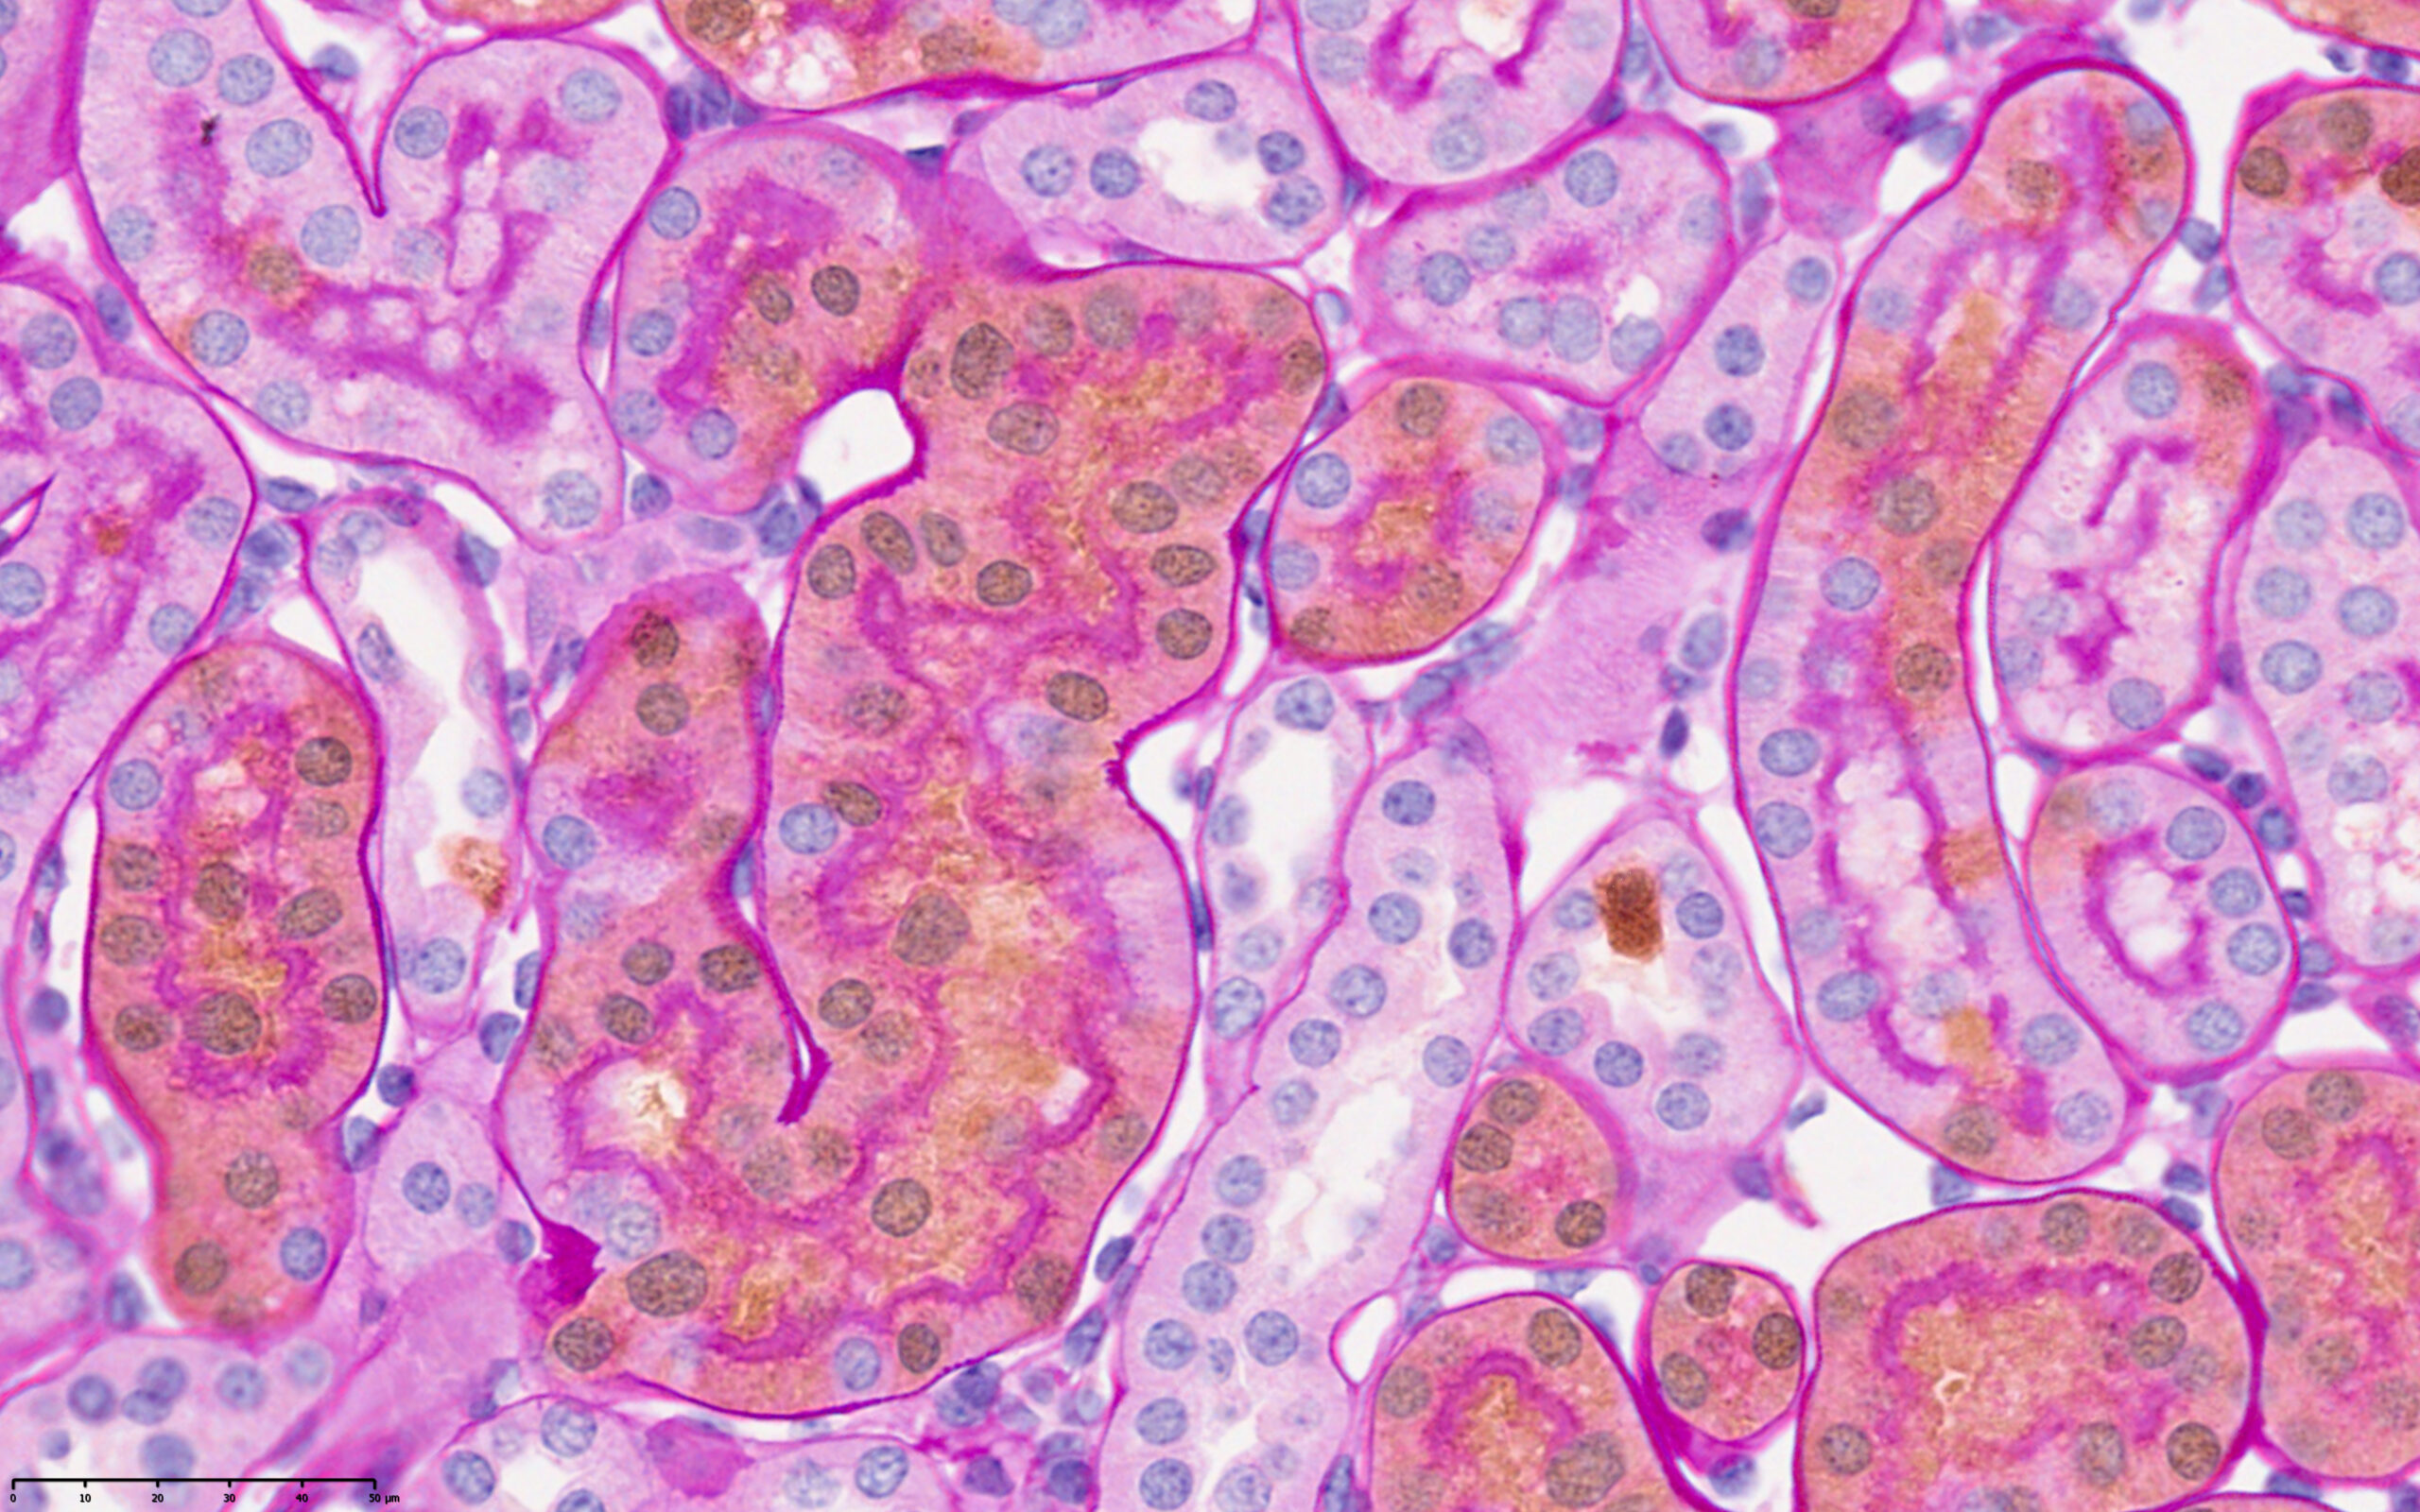
This image was shared by Samvid Kurlekar and Joanna Lima, postdocs in Peter Ratcliffe’s lab at Ludwig Oxford.
“Our lab studies the earliest events of oncogenesis in the kidneys following von Hippel Lindau (VHL) and Polybromo-1 (Pbrm1) gene inactivation in the renal cortical tubular epithelium,” Samvid and Joanna said. “We trace the behavior of early oncogenic cells using a cell tagging mouse model that labels Vhl/Pbrm1-null cells with a tdTomato reporter. We have developed a dual immunohistochemistry (IHC)/Periodic Acid Schiff (PAS) staining protocol that allows us to identify and assay Vhl/Pbrm1-null cells (stained ‘brown’ by tdTomato IHC) against the structure of renal cortical tubules, whose basement membranes and brush borders are stained pink with PAS. In this image, we can identify specific Vhl/Pbrm1-null cells with altered morphology that have either extruded into the tubular lumen or are invading the renal interstitium. This invasive behavior is potentially of great relevance to oncogenesis and merits further study. In addition to its scientific and aesthetic value, this image shows us that in an age of ever-expanding “omics” technologies, profound biological discoveries can still be made with decades-old IHC and PAS technologies.”
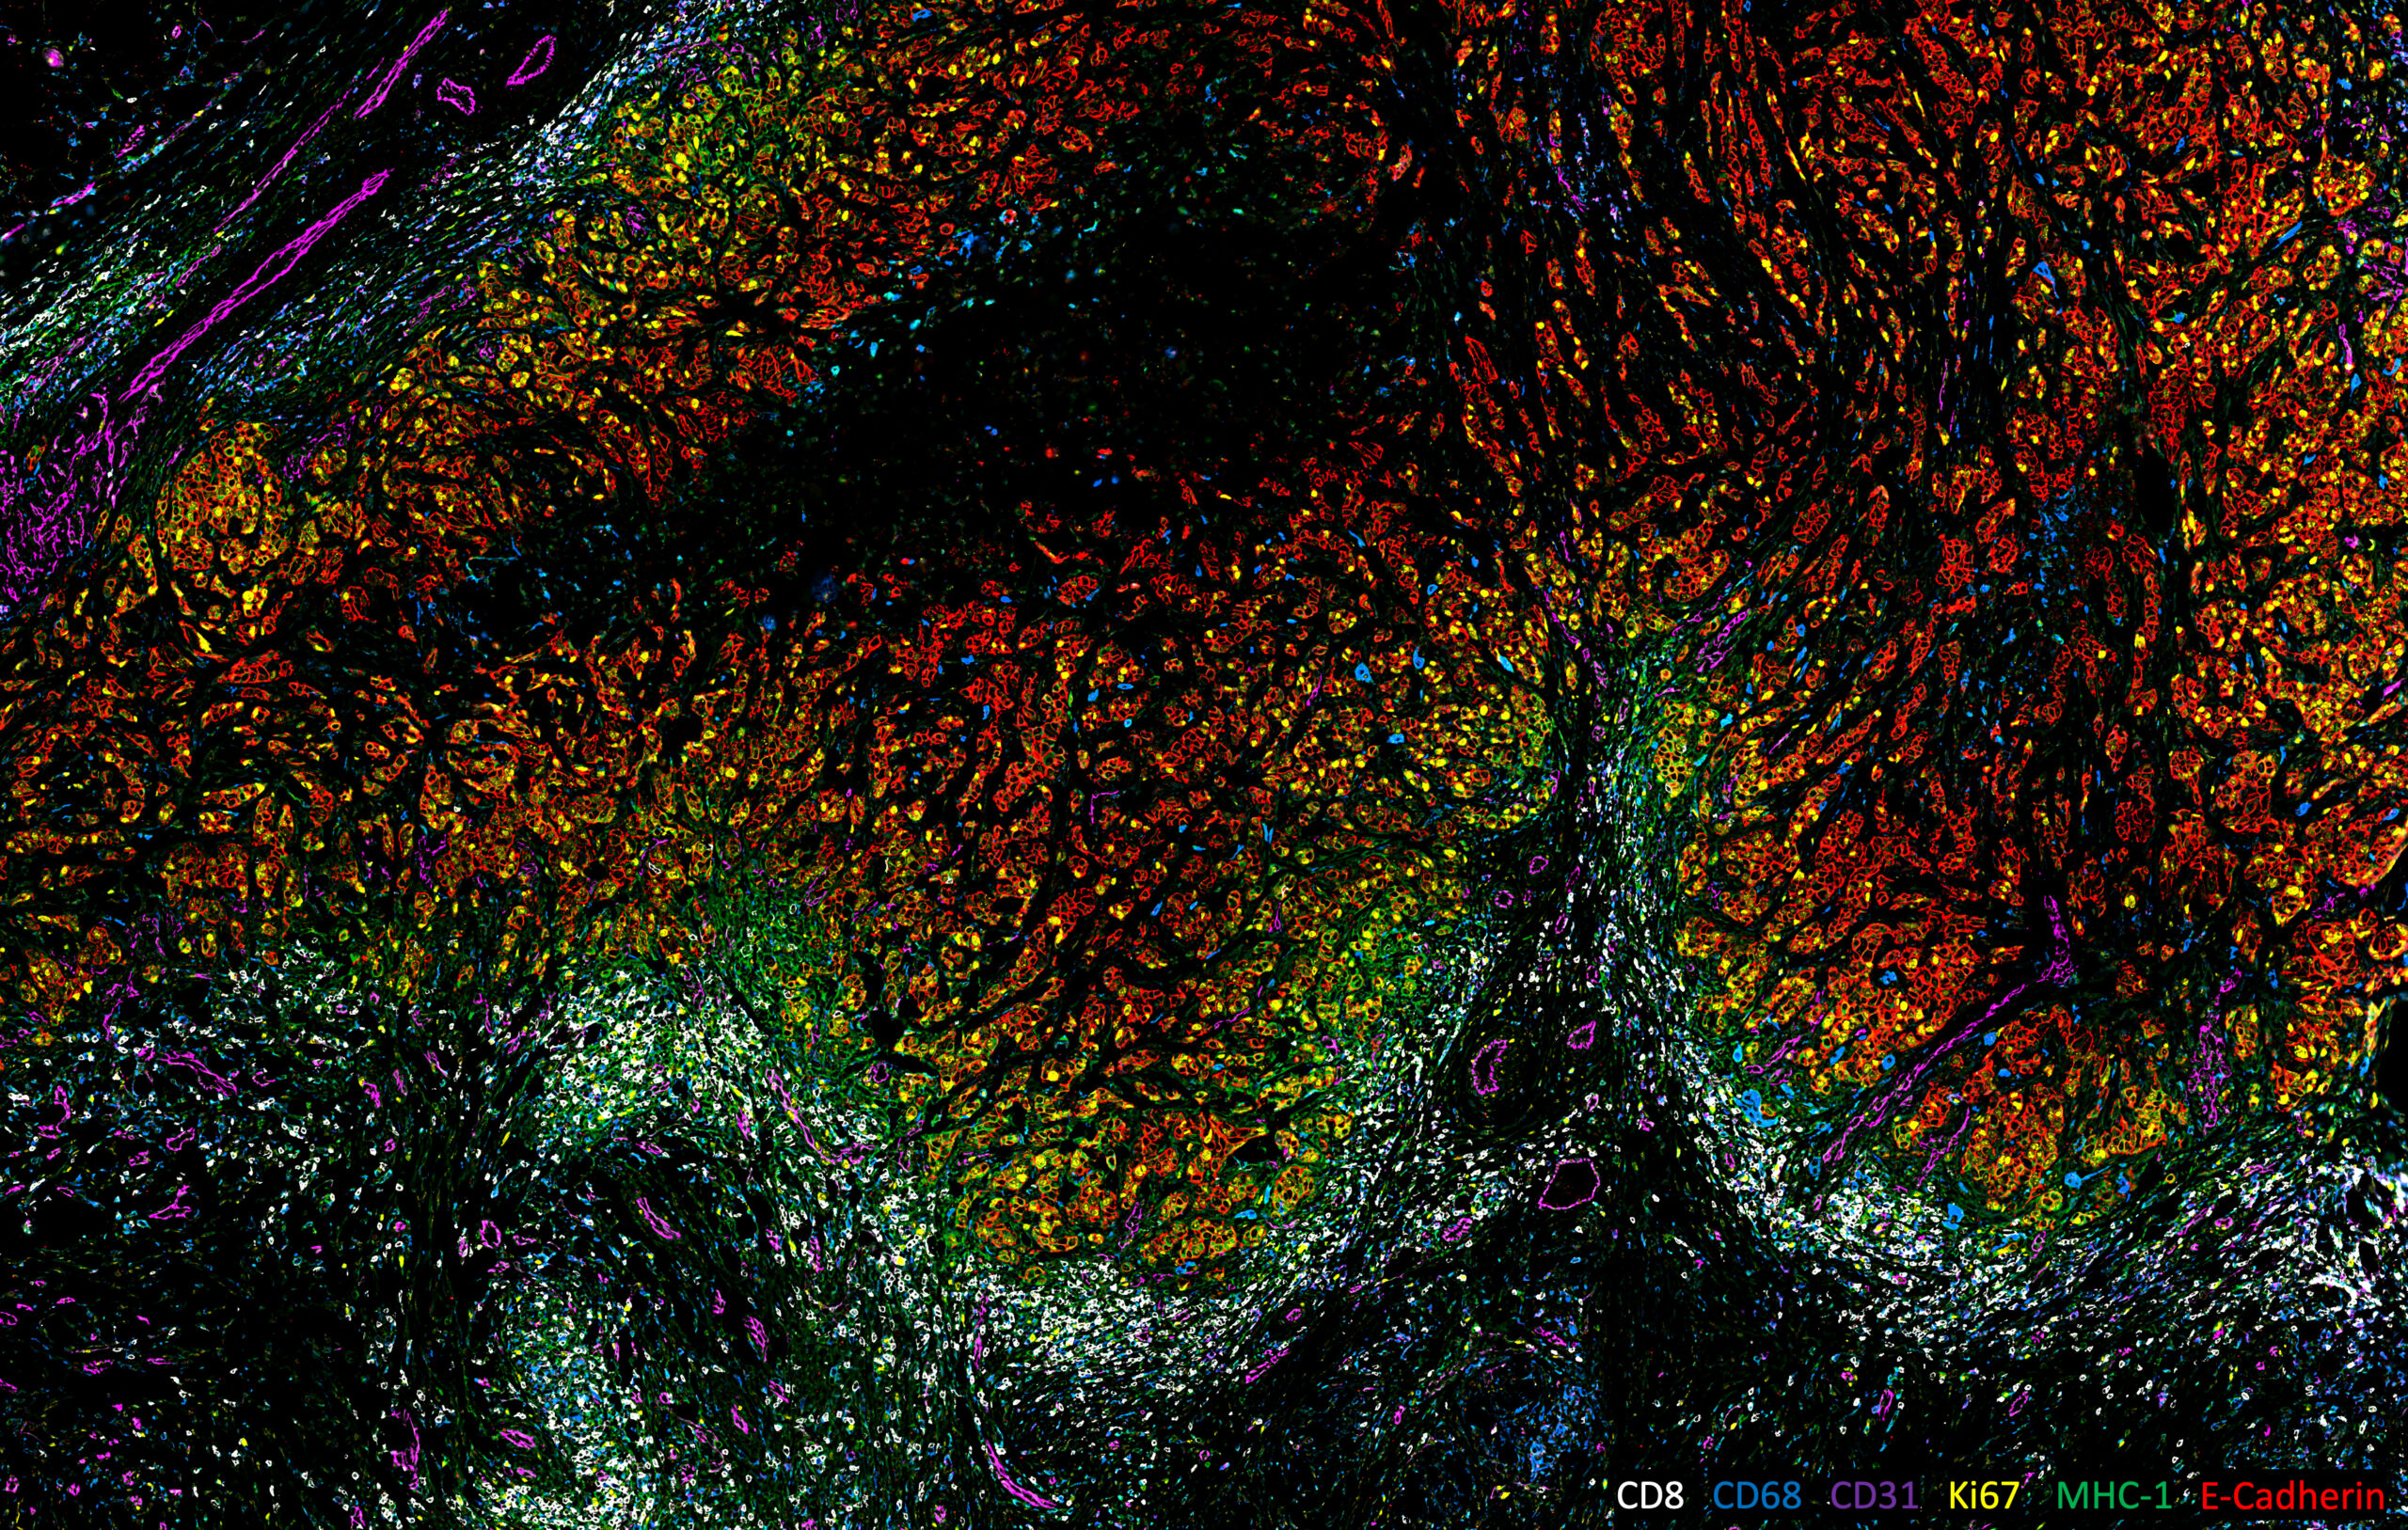
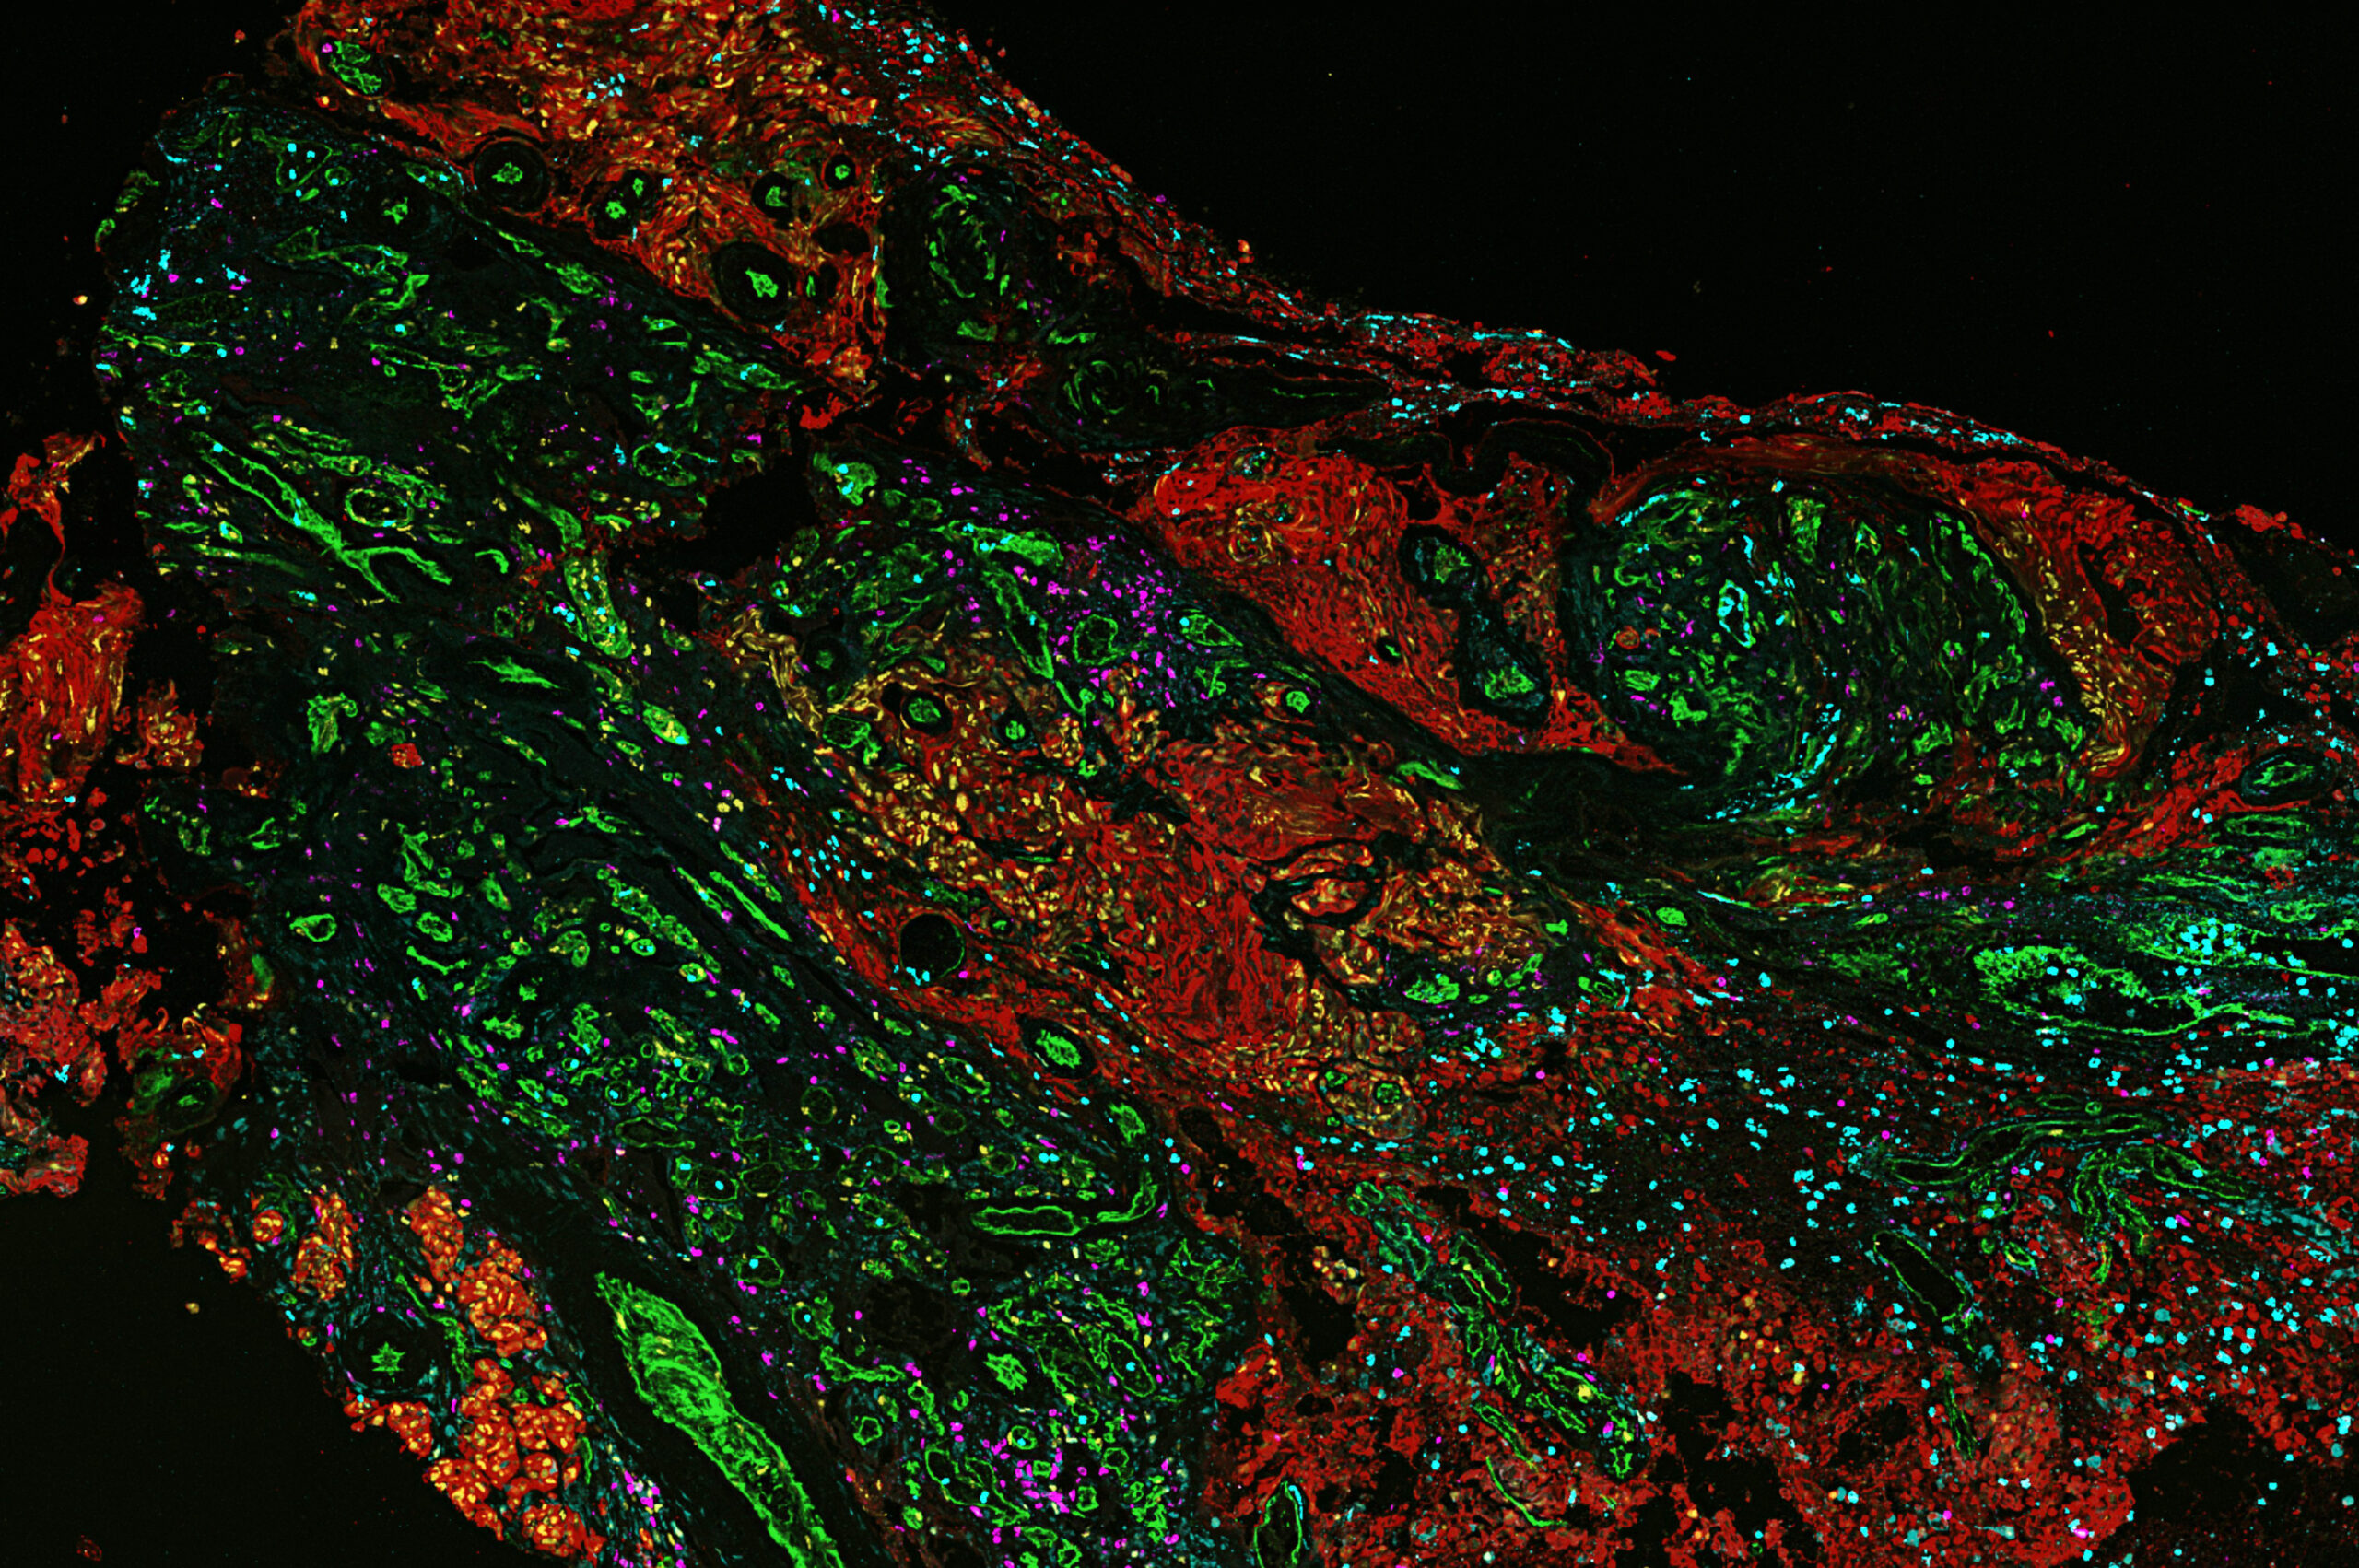
This image was shared by Ye Tian, Maxime Meylan and Kai Wucherpfennig at Ludwig Harvard.
This image comes from an ongoing study investigating the spatial features that drive immune exclusion in human triple-negative breast cancer (TNBC) tumors. “In our preliminary work, we found that the T cell infiltration in human TNBCs is correlated with tumor spatial patterns, which are highly heterogeneous within and between tumors,” Ye Tian said. “Taken in 2022, the image exhibits a typical immune-excluded pattern of TNBC, in which the T cells accumulate around the tumor edge but are unable to infiltrate into the tumor nest. The sample imaged here is an FFPE section of a human TNBC tumor imaged using the CODEX multiplex imaging platform equipped with a Zeiss Axio Observer 7 microscope. The image highlights the immune-exclusion spatial feature of this TNBC case. Tumor cells (E-Cadherin+, red) are highly proliferative (Ki67+, yellow) and exhibit heterogeneous MHC-I expression. Macrophages (CD68+, blue) and blood vessels (CD31+, magenta) infiltrate the tumor, while numerous cytotoxic T cells (CD8+, white) are restricted to the tumor periphery and excluded from the tumor nest. I love the color pattern of this beautiful micrograph, which simultaneously and clearly depicts six parameters of the tumor microenvironment. Our title for the image, Siege and Stalemate, not only captures the local pattern between tumor cells and T cells in this particular sample but also refers to the broader impasse between TNBC and currently available immunotherapies: For a substantial proportion of TNBC patients, immunotherapies have yet to achieve durable and effective responses.”
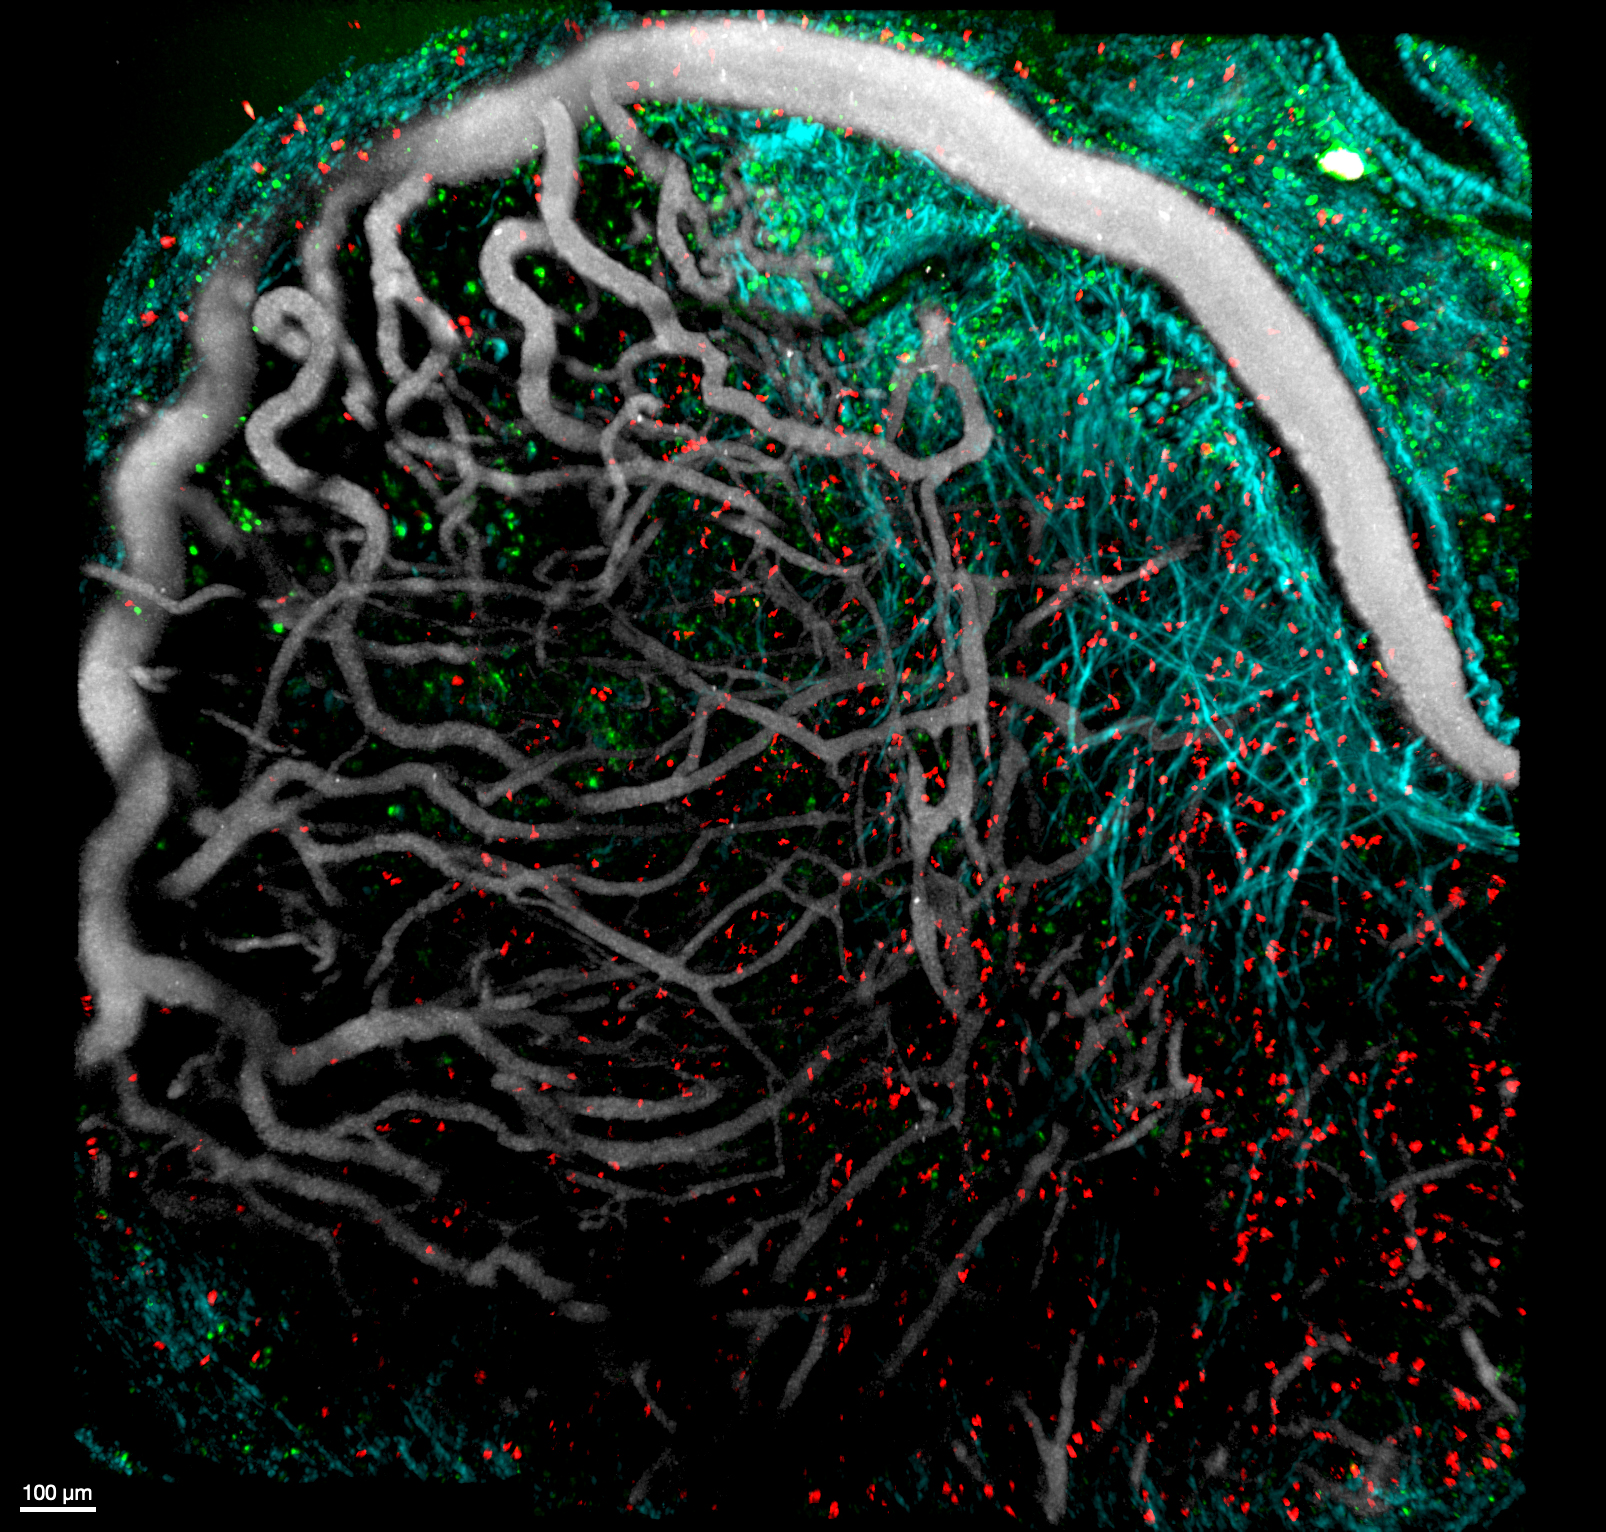
This image was shared by Stefania Vilbois, a graduate student in Ping-Chih Ho’s laboratory at Ludwig Lausanne.
This is an intravital 2-photon image of a mouse melanoma ten days post-engraftment, with CD8+ tumor-infiltrating lymphocytes (TILs, orange and red), dendritic cells (green), blood vessels (Qdot, gray), and collagen fibers (second harmonic generation, cyan). “To track the localization of tumor-specific CD8+ T cells and conventional type 1 dendritic cells (cDC1) in the tumor microenvironment (TME), we used a mouse reporter model (XCR1-DTR-Venus) to monitor cDC1 with a Venus reporter (FITC, green),” Stefania told us. “We adoptively transferred naive tumor-specific CD8+ T cells from a mouse cell lineage tracing strain before tumor engraftment. Using this cell lineage tracing system, we identified TCF1+ CD8+ progenitor T cells (GFP and Tdtomato, orange) that differentiated into TCF1- CD8+ exhausted T cells (Tdtomato, red). We are investigating the role of cDC1 in the tumor microenvironment and how it can improve the anti-tumor immune response. One way is by preserving the progenitor-like TCF1+ state of CD8+ TILs. Another is by helping TILs to migrate into the tumor. We compared the distribution of progenitor-like and exhausted-like TILs in the presence of XCR1+ cDC1 and after XCR1+ cDC1 depletion. The image was taken in July 2021. It was my first session with the 2-photon microscope, and we were fortunate that the setup worked in the first try. Unfortunately, this wasn’t always the case, as each mouse tumor grows differently, and stabilizing the tumor for long acquisition without being affected by the mouse breathing is challenging.”
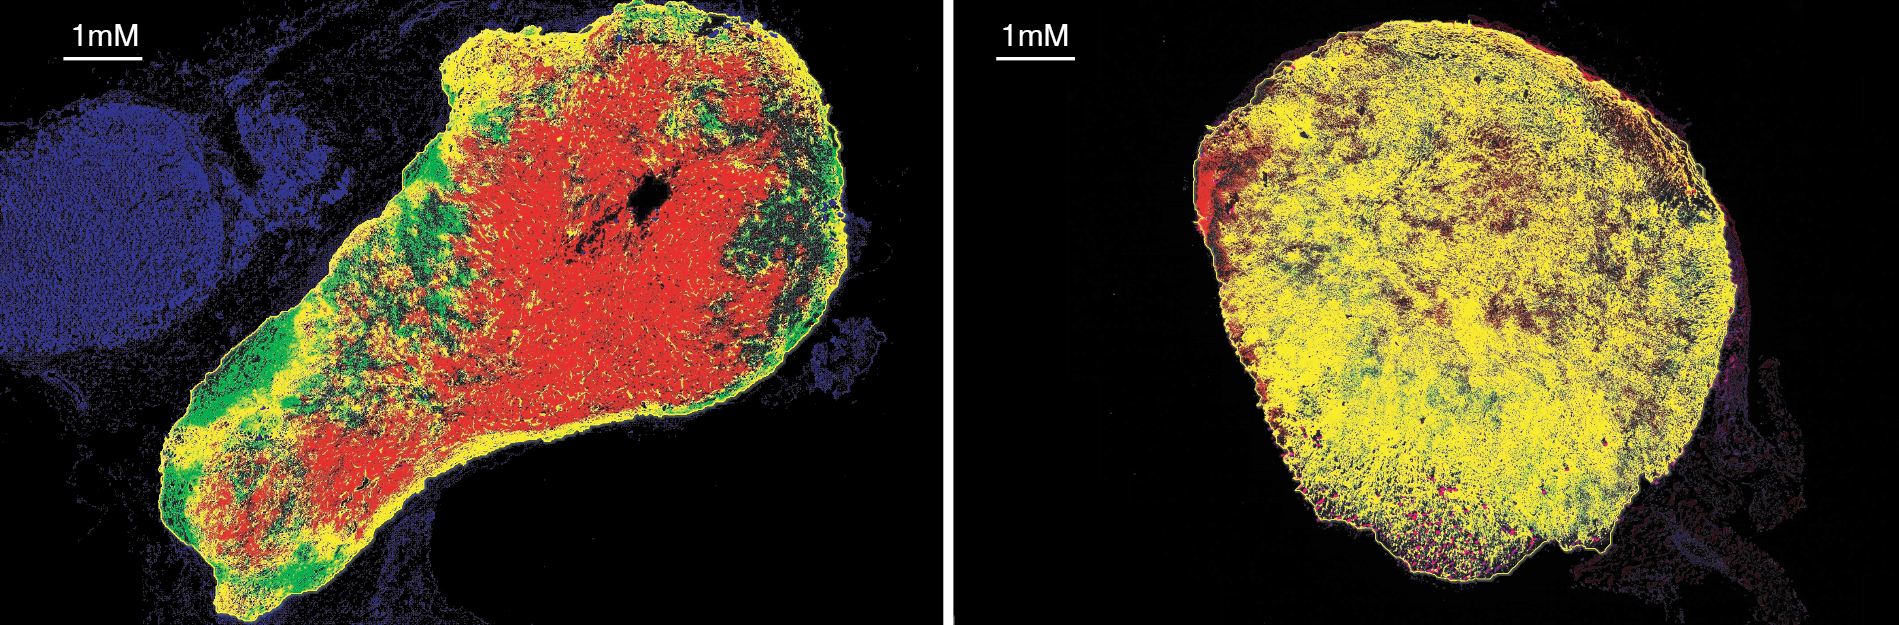
This image was shared by Jingjing Zhu, who is in Benoît Van den Eynde’s laboratory in Brussels.
These images reveal the limited tumor penetration of systemically administered anti-PD-L1 antibodies and the preclinical success of a strategy to overcome this limitation by engineering tumor-targeting CD8+ T cells to locally secrete an anti-PD-L1 nanobody, leveraging the tumor-homing ability of the T cells. The approach has two potential advantages: Nanobodies are produced where needed, bypassing penetration issues, and their short half-life and localized delivery prevents systemic buildup, reducing the risk of side effects. “We showed that our strategy achieved superior tumor control in a mouse model compared to conventional anti-PD-L1 antibody injection,” Jingjing told us. This improvement was primarily due to the improved tumor penetration of locally delivered nanobodies right image, green)—which infiltrated the tumor and blocked PD-L1 (red) at the tumor site—compared to systemic anti-PD-L1 antibodies (left image, green). The yellow staining represents successful binding events (green + red = yellow), where the green-labeled antibodies have bound to red-labeled PD-L1 molecules in the tumor tissue. “The predominance of yellow in the [right] image suggests our engineered T-cell approach achieves superior target engagement compared to conventional antibody delivery (left panel), visually confirming our hypotheses.”